Stablecoin Supply as a Liquidity Signal: Tracking USDT and USDC Issuance Before Crypto Breakouts
Rising stablecoin supply is often read as a bullish sign. Traders see a large USDT or USDC mint and assume fresh capital is about to push BTC, ETH, or altcoins higher. Sometimes that happens. Often, it does not.
The reason is simple: stablecoin creation is not the same as buying pressure. New tokens can stay in issuer treasury wallets, move to custodians, support OTC settlement, or sit defensively instead of moving into risk assets. On their own, “stablecoin printing” headlines are weak trading signals.
This article explains a more useful way to read the data. The key is to separate latent liquidity from deployable liquidity by combining net issuance with exchange inflows and balances. If you want a cleaner framework for judging breakout probability, that distinction matters more than headline mint numbers.
What Stablecoin Supply Can and Cannot Tell You
Why traders watch USDT and USDC supply
USDT and USDC function as crypto market cash equivalents. They are used for spot purchases, derivatives collateral, cross-exchange transfers, OTC settlement, and defensive positioning. Because of that, rising supply can indicate that more dollar-like capital is entering the crypto system.[^1][^2]
That matters because breakouts usually need liquidity. If stablecoin capital is expanding, the market may have more fuel for future buying.
The main mistake: issuance is not buying
A mint is only a token creation event. It does not mean the tokens have been distributed, sent to exchanges, or used to buy assets.
A useful analogy: printing train tickets does not mean passengers have boarded. Total supply tells you more tickets exist. Exchange inflows tell you more passengers are entering the station. Spot buying tells you the train is actually leaving.
Common Mistake: Treating a large mint as proof of immediate buying power.
The distinction that matters
- Supply growth shows whether more crypto-native cash exists.
- Exchange balance growth shows whether that cash is moving closer to where it can be deployed quickly.
Bottom Line: Stablecoin issuance is a context signal. It becomes much more useful when exchange balances and price action confirm that liquidity is moving toward risk assets.
What Stablecoin Supply Actually Measures
Minting, net issuance, and circulating supply are not the same
These terms are often blurred together:
- Mint: a token creation event, often sent first to an issuer treasury wallet
- Net issuance: issued supply minus redeemed supply over a period
- Circulating supply growth: the increase in outstanding tokens actually in circulation
That is why headline numbers can mislead. “$1 billion USDT minted” sounds bullish, but if a similar amount is later redeemed, held in treasury, or not distributed, the market impact may be limited.[^1]
For analysis, 7-day and 30-day net issuance are usually more useful than isolated mint announcements.
Why supply can rise without a rally
Stablecoins are used for more than buying BTC:
- Exchange collateral
- Derivatives margin
- OTC settlement
- Cross-border transfers
- DeFi collateral
- Defensive parking during volatility
That is why stablecoin market cap can grow even when crypto prices are flat or weak.
Different drivers imply different market outcomes
| Driver of supply growth | What it may reflect | Bullish for immediate breakout? |
|---|---|---|
| Speculative capital entering crypto | New risk appetite | Often yes |
| Defensive positioning after selling | Traders moving to cash-like assets | Not immediately |
| OTC settlement demand | Capital active off-exchange | Maybe, but unclear |
| Derivatives collateral demand | More leverage capacity | Mixed |
| DeFi or yield allocation | Capital staying on-chain but not buying spot | Often no |
Key Insight: Rising stablecoin supply tells you liquidity exists somewhere in the system. It does not tell you where it is sitting or what it is about to do.
Why Exchange Balances Matter More Than Supply Alone
Where the tokens are matters
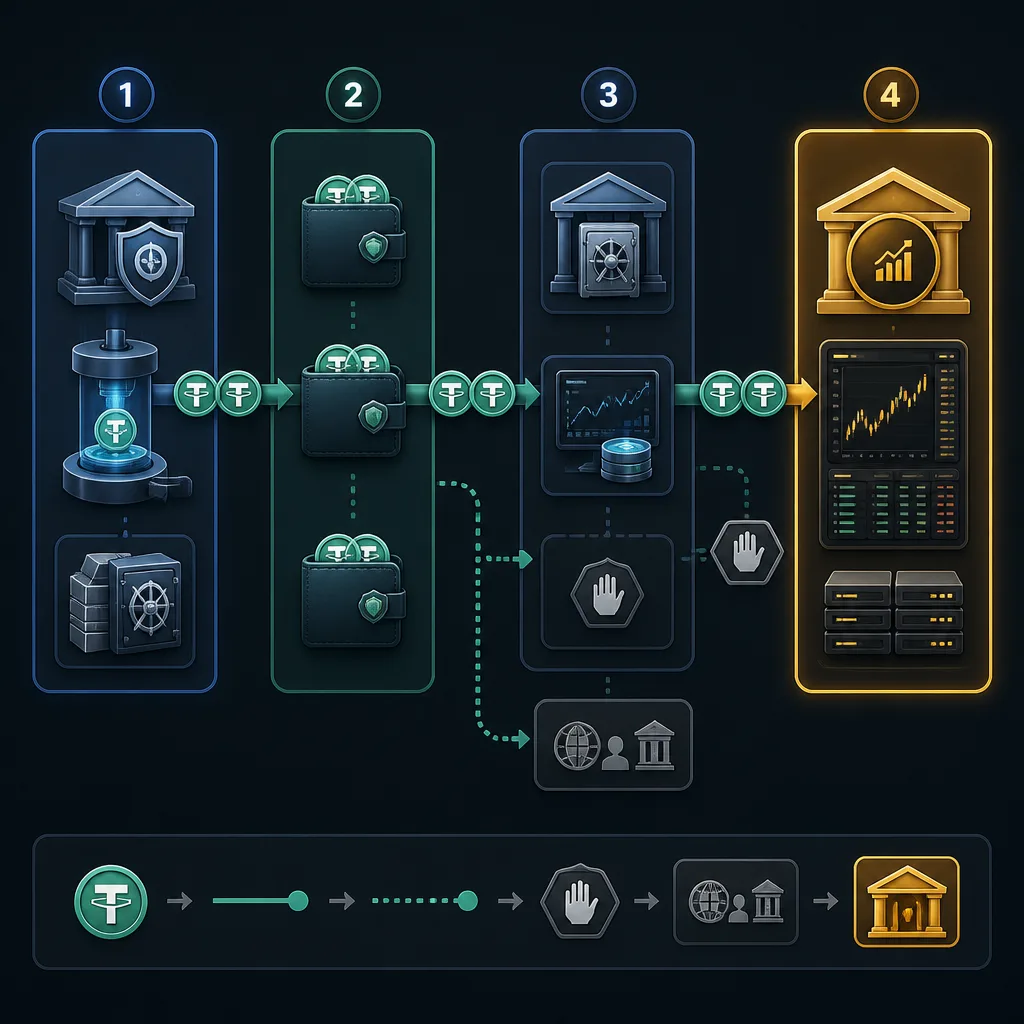
A stablecoin often moves through several stages:
- Issuer mints tokens
- Tokens sit in treasury or distribution wallets
- Tokens move to custody, market makers, OTC desks, or clients
- Some portion reaches centralized exchanges
Only the last stage is a stronger proxy for near-term buying power.
Capital on an exchange is usually closer to execution than capital sitting in treasury, self-custody, or a DeFi vault.
A better mental model
- Total supply = size of the fuel tank
- Exchange balances = fuel near the engine
If the tank gets bigger but no extra fuel reaches the engine, a breakout may not happen yet.
When supply rises but exchanges stay flat
This setup appears often. Tether supply can trend higher for weeks while BTC stays range-bound. Traders may read the supply growth as bullish, but price does not respond because the new liquidity is not reaching trading venues in size.
That does not make the signal useless. It means the timing is unclear. Stablecoin creation may lead price by days, weeks, or not at all.
Decision Rule: If stablecoin supply rises but exchange balances stay flat or fall, treat it as watchlist liquidity, not breakout confirmation.
The Two-Layer Liquidity Model
This article’s core framework is the Two-Layer Liquidity Model:
- Layer 1: Stablecoin supply growth
- Layer 2: Stablecoin exchange balance growth
How to use it
Layer 1 gives the medium-term backdrop. It tells you whether the system is gaining or losing stablecoin liquidity.
Layer 2 gives the near-term deployment signal. It shows whether liquidity is moving toward venues where it can affect price more directly.
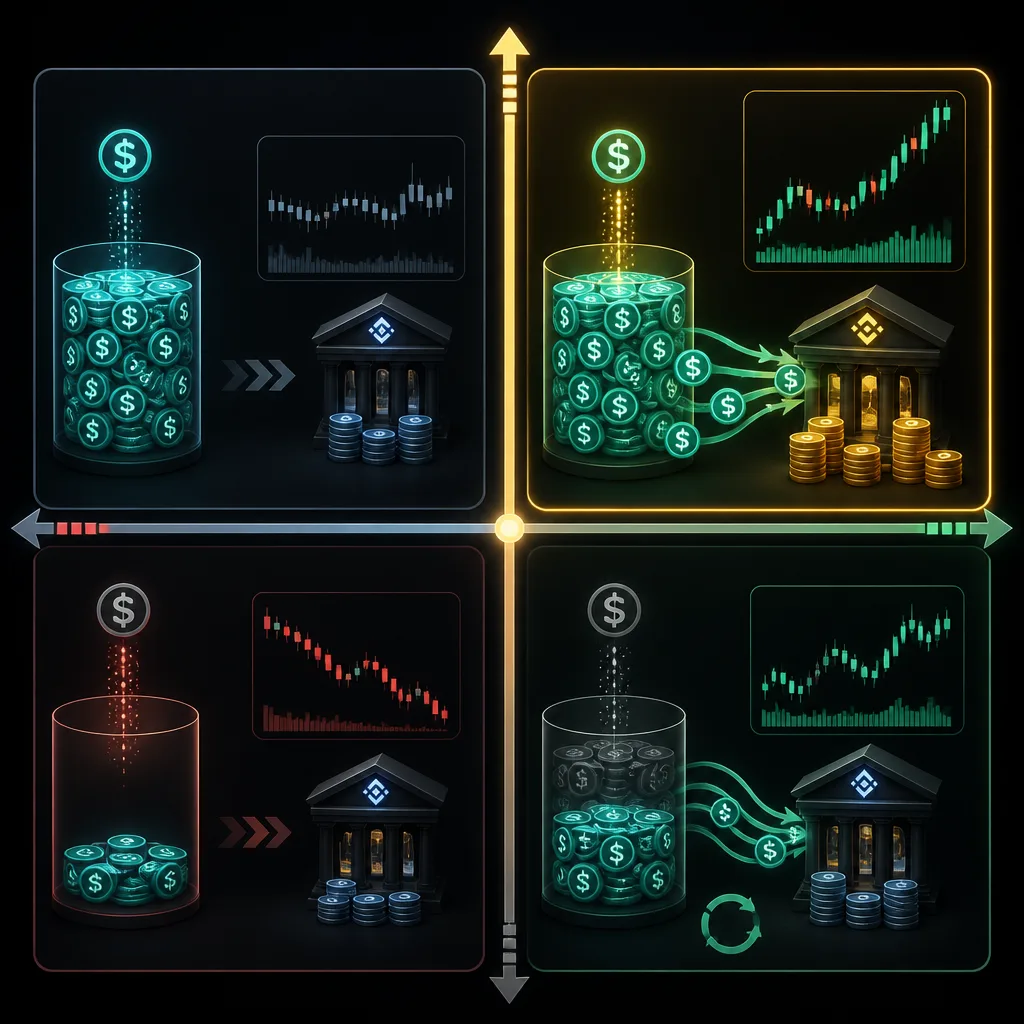
The four main combinations
| Supply growth | Exchange balance growth | What it usually suggests | Breakout implication |
|---|---|---|---|
| Up | Up | New liquidity is being created and moved toward markets | Most supportive |
| Up | Flat/Down | Liquidity exists but may be idle, off-exchange, or defensive | Weak confirmation |
| Flat | Up | Previously issued stablecoins are rotating onto exchanges | Often important short term |
| Down/Flat | Down | Liquidity support is weakening or moving away from venues | Least supportive |
A subtle but important point: flat supply with rising exchange balances can matter more for a near-term breakout than fresh issuance headlines. Markets react to deployable liquidity, not just expanding supply.
Bottom Line: The strongest setup is not simply “more stablecoins.” It is more stablecoins moving toward execution venues while price structure tightens near key levels.
A Practical Framework: Is the New Supply Likely to Be Used?
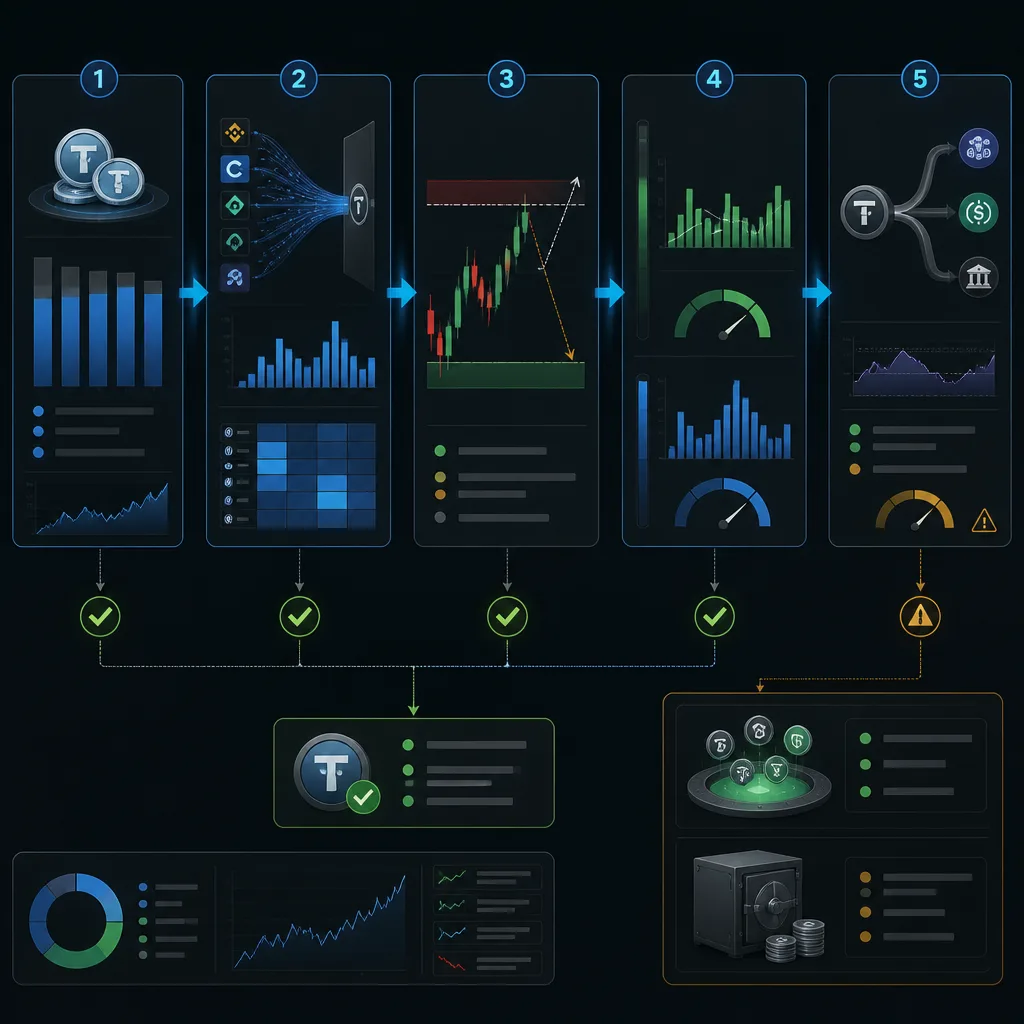
Use this process instead of reacting to mint headlines.
Step 1: Measure recent net issuance
Track:
- 7-day change in USDT circulating supply
- 7-day change in USDC circulating supply
- 30-day change in both
- Aggregate stablecoin market cap as a secondary context layer
This helps separate trend from noise.
Step 2: Check exchange flows
Look at:
- Stablecoin exchange balances
- Stablecoin netflows
- Whether inflows are broad across multiple venues or concentrated on one exchange
Broad inflows are usually more informative than a spike on a single derivatives-heavy venue.
Step 3: Compare the timing with market structure
Liquidity matters most when price is near a decision point.
Stablecoin inflows are more relevant if:
- BTC or ETH are compressing below resistance
- Price is reclaiming a key level
- The market is exiting a long consolidation
They matter less in the middle of a noisy range.
Step 4: Look for confirmation
A stronger breakout setup usually includes:
- Expanding spot volume
- Controlled funding rates
- Rising but not extreme open interest
- Price being led by spot demand rather than only perpetual futures
If open interest rises much faster than spot participation, the move may be leverage-led and fragile.
Step 5: Ask where the liquidity may be going instead
Possible destinations include:
- DeFi money markets
- Yield products
- Tokenized Treasury products
- OTC inventories
- Exchange-specific collateral pools
Key Insight: Stablecoin issuance should raise your attention. It should not trigger execution by itself.
How the Signal Looks in Real Market Setups
Scenario A: Supply up, exchange balances up, price near resistance
This is the cleanest setup.
Example: BTC spends two weeks just below a major resistance band while 7-day USDT supply rises, exchange-held stablecoin balances climb across several major venues, and spot volume improves. In that environment, the market is showing both new liquidity and better positioning for deployment.
It does not guarantee a breakout, but it improves the odds.
Scenario B: Supply up, exchange balances flat
This is the classic false positive.
A large Tether mint makes headlines. Market sentiment turns bullish. But exchange balances remain flat, BTC stays below resistance, and volume does not improve. A week later, price is still range-bound.
In that case, the new supply may be:
- Sitting in treasury
- Held in custody
- Used for OTC settlement
- Positioned defensively
This is why supply alone is not enough.
Scenario C: Exchange inflows rise without fresh issuance
This setup is easy to miss and often more actionable.
Suppose USDT and USDC supply are mostly flat on a 7-day basis, but exchange balances start rising as BTC compresses near a breakout level. That can mean previously issued stablecoins are rotating onto venues now, which may matter more for immediate price action than whether issuers minted fresh tokens this week.
Scenario D: Exchange balances rise during risk-off conditions
This is another common misread.
If BTC is making lower highs, spot demand is weak, and exchange stablecoin balances rise after a selloff, traders may simply be sitting in cash on-exchange. That creates future optionality, but it is not automatically bullish in the short term.
Common Mistake: Assuming all stablecoin exchange inflows are bullish. Sometimes they reflect traders reducing risk and waiting.
Common Failure Modes
Stablecoins may be chasing yield, not BTC
Supply can expand because users want yield in DeFi or centralized products, not because they want crypto exposure.
Off-exchange activity can hide real liquidity
Large desks may hold capital in custody or use it in OTC channels. That liquidity is real, but it may not appear clearly in public exchange-balance data.
Internal transfers can distort the data
Chain migration, treasury rebalancing, and wallet relabeling can create misleading flow signals. Supply can fall on one chain and rise on another without much change in actual market liquidity.
USDT and USDC do not always mean the same thing
Tether and Circle serve different user bases and operate under different constraints.[^1][^2] USDC changes may reflect more institutional or regulatory dynamics. USDT growth may reflect offshore settlement demand that is not directly tied to speculative buying.
Bottom Line: Stablecoin data is useful, but noisy. It offers probabilistic clues, not direct proof of future buying.
How to Track It in Practice
Metrics worth monitoring
For weekly context, track:
- 7-day and 30-day USDT net issuance
- 7-day and 30-day USDC net issuance
- Aggregate stablecoin market cap
- Aggregate stablecoin exchange balance trend
For daily timing, track:
- Stablecoin net exchange inflows
- BTC/ETH position relative to resistance
- Spot volume trend
- Open interest trend
- Funding rates and basis
Useful data sources
- Tether Transparency for issuer-side USDT supply data[^1]
- Circle Transparency for USDC circulation and reserve disclosures[^2]
- Coin Metrics for network-level supply and flow data[^3]
- Glassnode and CryptoQuant for exchange balances, reserves, and netflow metrics[^4][^5]
- DefiLlama, Artemis, and Nansen for broader ecosystem flow context
Be careful with methodology. “Exchange reserves,” “exchange balances,” and “netflows” are related, but not identical. Address attribution also varies by provider.
Weekly liquidity checklist
- Record 7-day and 30-day USDT supply change
- Record 7-day and 30-day USDC supply change
- Note aggregate stablecoin market cap trend
- Check whether exchange stablecoin balances are rising or falling
- Identify whether flows are broad-based or venue-specific
- Mark BTC and ETH relative to major resistance/support
- Note whether spot volume is improving
- Check open interest and funding for leverage excess
- Review whether stablecoins may be rotating into DeFi, custody, or OTC channels
Decision Rule: Weekly data gives you the backdrop. Daily data helps with timing. Do not use mint headlines as a substitute for either.
Bottom Line: Use Supply as Context, Not a Trigger
Stablecoin supply is useful for identifying whether crypto-native liquidity conditions are expanding or contracting. That makes it a strong context signal for medium-term market conditions.
What it does not tell you is:
- where the capital is sitting
- when it will be deployed
- whether it is meant for spot buying, hedging, or settlement
- whether price will respond
The strongest interpretation is:
- USDT and USDC net issuance are rising
- Stablecoin exchange balances are also rising
- BTC or ETH are near a key breakout level
- Spot volume confirms
- Leverage is not doing all the work
That is the practical use of this signal. Treat supply growth as latent liquidity, exchange balances as deployable liquidity, and price/volume confirmation as the point where liquidity becomes active.
Conclusion
Stablecoin growth matters, but not for the reason many headlines imply. A larger stablecoin market cap does not automatically mean a rally is about to begin. More often, it means there is more potential liquidity in the system, not necessarily more immediate buying pressure.
The more useful approach is to separate creation from deployment. If USDT or USDC net issuance rises and exchange balances rise with it, the signal gets stronger. If supply rises but the funds stay off-exchange, the market may have more fuel without more power at the wheel.
For breakout forecasting, the practical rule is simple: upgrade the signal only when supply growth, exchange balance growth, and market structure align.
FAQ
Does rising stablecoin supply predict crypto price increases?
Not by itself. Rising supply usually means more crypto-native cash exists in the system, but it does not prove that capital is being deployed into BTC, ETH, or altcoins. The signal becomes more useful when supply growth is paired with rising exchange balances and supportive price structure.
What is the difference between a mint, net issuance, and circulating supply growth?
A mint is a token creation event, often to an issuer treasury wallet. Net issuance measures newly issued supply minus redeemed supply over a period. Circulating supply growth reflects the change in outstanding tokens actually in circulation. A headline mint does not necessarily mean new buying power is active.
Why is stablecoin issuance not the same as buying pressure?
New USDT or USDC can remain in treasury, move into custody, support OTC settlement, back derivatives collateral, or sit in defensive cash positions. Only when stablecoins move closer to trading venues and are used in market activity do they become a stronger proxy for near-term buying pressure.
Why do exchange balances matter more than total supply?
Exchange balances are generally a better proxy for deployable liquidity because funds on centralized exchanges are closer to immediate use in spot or derivatives markets. Total supply is more like potential fuel, while exchange balances show how much of that fuel is near the engine.
What does it mean if supply rises but exchange balances stay flat?
It usually suggests that liquidity is being created but not yet positioned to buy. That can mean treasury inventory, off-exchange custody, OTC settlement, DeFi allocation, or defensive demand. In practice, this setup is less supportive for immediate breakout follow-through than supply growth plus exchange inflows.
Can exchange inflows rise for bearish reasons?
Yes. Traders may move into stablecoins on exchanges after selling crypto during risk-off periods. In that case, exchange stablecoin balances rise, but the behavior reflects caution rather than fresh appetite for risk. That is why price structure, spot volume, and market context matter.
How should traders use USDT and USDC issuance in practice?
Track 7-day and 30-day net issuance for both, compare that with exchange balance changes, then check whether BTC or ETH are pressing key resistance with improving spot volume. Treat issuance as context and upgrade the signal only when exchange balances and price action confirm.
What are the main failure modes of this signal?
Common failure modes include stablecoins rotating into yield products or money markets, off-exchange custody and OTC activity hiding deployable liquidity, chain migration distorting supply data, internal transfers creating false exchange-flow signals, and issuer-specific events affecting supply for reasons unrelated to immediate crypto buying.