Hidden Crypto Market Correlations: 5 Signals That Can Lead Price
Most traders notice market correlations only after the move. BTC drops, then they realize DXY was rising, funding was stretched, or ETF inflows were fading. That may help explain what happened, but it does not help much with timing.
The more useful question is: which signals can lead price, when do they matter, and when are they just noise? In crypto, that distinction matters because the same relationship can be strong in one regime and irrelevant in the next.
This guide looks at five signals that often move ahead of major crypto price shifts: DXY regime changes, US real yields, stablecoin net issuance, perpetual funding with open interest, and miner or ETF flow pressure. More importantly, it explains why they can lead, when they fail, and how to test them before risking capital.
Key Insight: A correlation becomes tradable only when you understand its mechanism, likely lag, and the market regime where it tends to work.
Why traders misuse correlation
The most common mistake is treating correlation as fixed.
BTC and DXY may move inversely for a month, then decouple when a crypto-specific catalyst takes over. Funding may look dangerously crowded, yet price keeps climbing because spot demand absorbs leverage. Stablecoin supply may rise, but the increase may come from treasury reshuffling rather than fresh buying power.
Common Mistake: Seeing two lines move together and assuming one reliably predicts the other.
A useful signal is not just related to price. It must improve a decision before the move, not just provide a cleaner story afterward.
What this guide helps you do
By the end, you should be able to:
- Identify whether a signal reflects liquidity, leverage, or forced flows
- Estimate the likely lead-lag window
- Recognize when a relationship depends on the current regime
- Test whether a signal is actually actionable with a simple backtesting process
What makes a correlation useful

Correlation alone is not enough
A correlation is interesting. A lead-lag relationship is potentially useful.
If DXY spikes and BTC often weakens two days later during macro tightening periods, that may be actionable. If both assets simply react to the same CPI print at the same time, the relationship is descriptive, not leading.
Three things matter:
- Mechanism — why the signal should affect crypto
- Lag window — how long it usually takes to matter
- Regime fit — the conditions where the relationship tends to hold
Explanatory signals vs tradable signals
An explanatory signal tells you why something happened. A tradable signal helps you position before the market has fully priced it in.
For example, real yields can matter because rates markets often digest macro changes faster than crypto. But if BTC is in a strong crypto-specific demand wave, rising real yields may explain macro headwinds without creating a clean short setup.
Decision Rule: If you cannot define the mechanism and the expected lag, you do not have an edge. You have a story.
A simple mental model
This article uses a three-bucket framework:
| Bucket | What it captures | Signals in this guide | Why it matters |
|---|---|---|---|
| Liquidity | Macro and crypto-native money conditions | DXY, real yields, stablecoin issuance | Shows whether capital is getting tighter or more available |
| Leverage | Positioning and liquidation risk | Funding + open interest | Shows whether price is vulnerable to squeezes |
| Forced flows | Structural buying or selling pressure | Miner selling, ETF flows | Shows whether spot demand is absorbing supply |
Bottom Line: The best signals are rarely isolated indicators. They are early clues inside one of these three buckets.
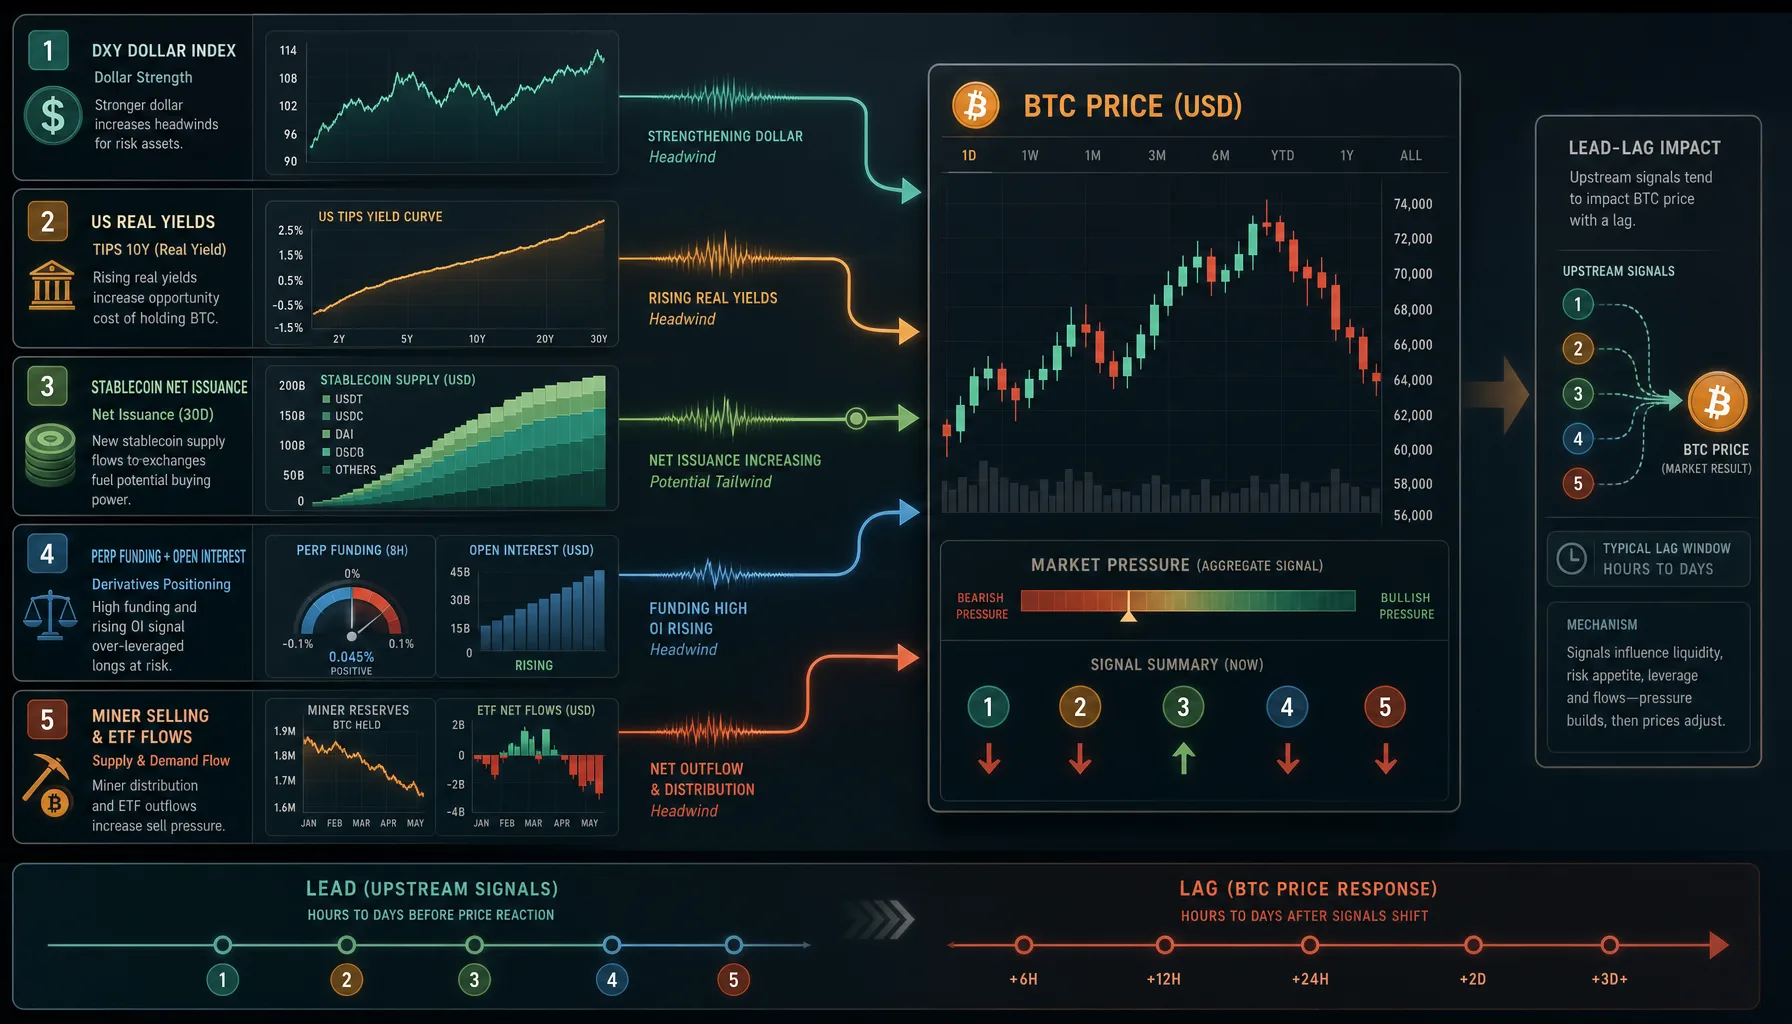
Signal #1: DXY regime changes
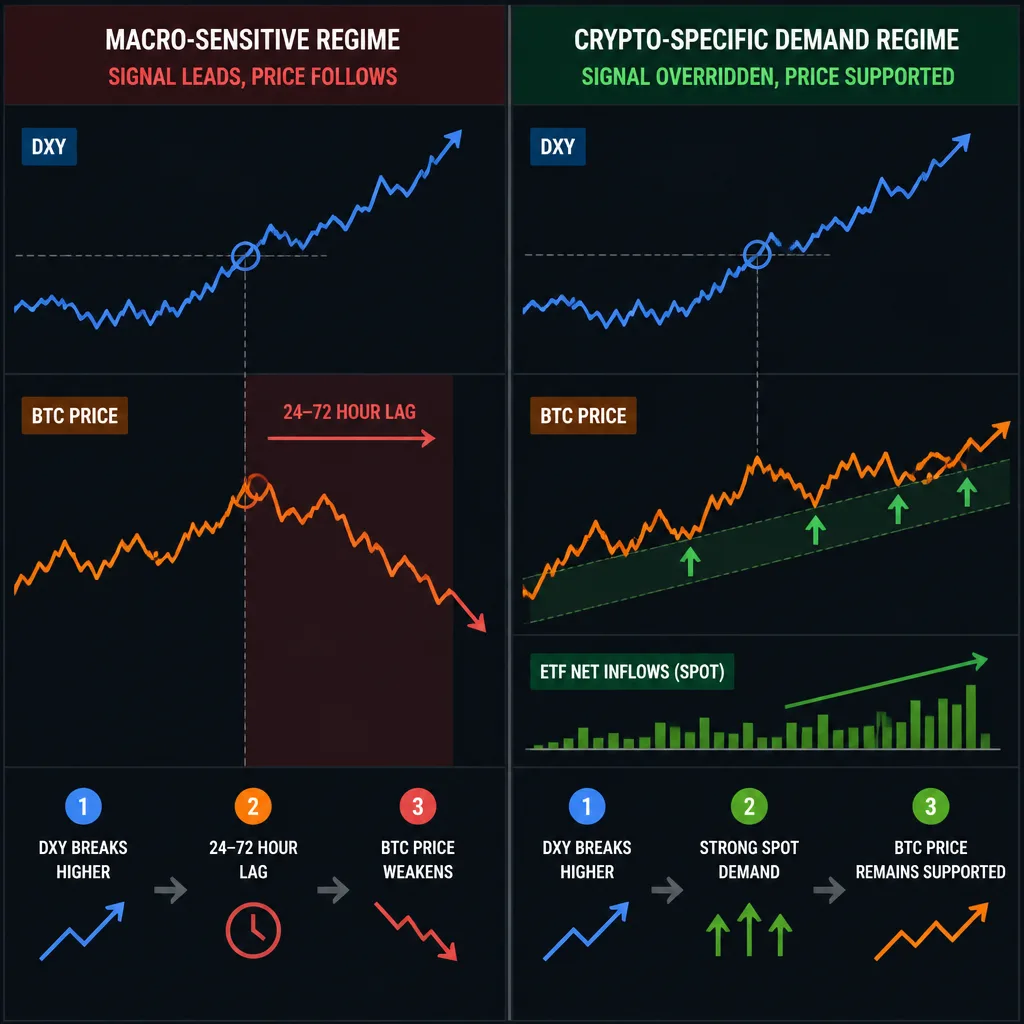
Why the US dollar can lead crypto
The DXY relationship matters most when Bitcoin is trading like a macro-sensitive risk asset. A stronger dollar often means tighter global financial conditions and weaker appetite for speculative assets.
This can lead crypto because macro traders and rates markets often reprice faster than crypto participants. DXY may break out first while BTC holds up briefly before demand starts to weaken.
When the inverse relationship gets stronger
This relationship tends to matter more during:
- Fed repricing cycles
- Broad risk-off periods
- Periods when BTC trades in line with tech and other growth-sensitive assets
Often, the change in trend matters more than the absolute level. A high but stable dollar may already be priced in. A sudden breakout or reversal is more likely to matter.
When DXY stops helping
The signal weakens when crypto is being driven by internal catalysts such as:
- Strong spot Bitcoin ETF demand
- Halving-related supply narratives
- Exchange-specific or regulatory events
- Broad speculative mania where macro is temporarily ignored
Example
Imagine a hotter-than-expected inflation print. DXY breaks above a multi-week range. BTC initially holds because crypto sentiment is still constructive. Over the next 24 to 72 hours, ETF inflows cool, risk assets fade, and BTC loses support.
That is a realistic use of DXY: not as a permanent inverse rule, but as an early warning that macro pressure is building.
Bottom Line: Watch for DXY breakouts and sharp reversals in macro-sensitive regimes. Do not assume the inverse relationship is constant.
Signal #2: US real yields
Why real yields matter more than nominal yields
Nominal yields can rise for different reasons. Sometimes the move reflects higher inflation expectations, which does not always hurt risk assets in the same way.
Real yields are more useful because they reflect inflation-adjusted returns on safer assets. When real yields rise, the opportunity cost of holding non-yielding assets like Bitcoin rises as well.
A practical proxy is the 10-year real yield, often tracked through the DFII10 series on FRED.
How rising real yields pressure BTC
Bitcoin does not produce cash flow. In macro tightening regimes, it can trade more like a liquidity-sensitive asset than digital gold. Rising real yields can reduce risk appetite across growth-sensitive markets, and BTC often feels that pressure with a lag.
What to watch
Focus on:
- The trend in the 10-year real yield
- Whether repricing lasts for several sessions
- Front-end policy repricing after CPI, payrolls, or Fed messaging
A one-day spike usually matters less than a sustained move.
When this signal fails
This signal can fail when crypto demand is unusually strong. A good example is a period of persistent ETF inflows absorbing supply even as yields rise. In that case, macro headwinds still exist, but spot demand can overpower them for a while.
Decision Rule: Use real yields as a macro filter, not a standalone trigger. Rising yields should reduce bullish conviction unless crypto-native flows are clearly offsetting them.
Signal #3: Stablecoin net issuance

Why stablecoin growth can lead price
Stablecoins represent deployable liquidity inside the crypto system. When supply in major stablecoins expands, it can signal fresh capital that may later rotate into BTC, ETH, or alts.
This is one of the few crypto-native liquidity signals that can lead price by days or weeks rather than minutes.
How to separate real demand from reshuffling
This is where many traders get misled.
Not all minting reflects new demand. Stablecoins can be issued for:
- Treasury management
- Chain migration
- OTC settlement
- Internal wallet reshuffling
That is why net issuance matters more than isolated mint events. Better still, check whether supply growth is paired with exchange-linked inflows or rising exchange stablecoin balances.
Which stablecoins and chains matter most
For broad market liquidity, USDT and USDC still matter most. Chain context matters too:
- Tron often reflects settlement and offshore activity
- Ethereum remains important for major trading and DeFi flows
- Solana and L2s can matter more during specific alt cycles
Example
Suppose USDT supply expands over several days, exchange stablecoin balances trend higher, and BTC is consolidating just below resistance. Price has not broken out yet, but buying capacity inside the system is improving. If spot structure then strengthens, the issuance becomes more meaningful.
Bottom Line: Stablecoin growth is most useful when three things align: net issuance, exchange-linked inflows, and improving spot structure.
Signal #4: Perpetual funding and open interest
Why leverage conditions can lead sharp moves
In derivatives-heavy markets, funding and open interest often matter before spot price fully reacts.
Funding tells you how expensive it is to hold long or short perpetual exposure. Open interest tells you how much leveraged positioning exists. Together, they reveal crowding, and crowding creates the conditions for forced liquidations.
How to read the combinations
| Setup | Typical read | Risk |
|---|---|---|
| High OI + very positive funding | Crowded longs | Long squeeze risk |
| High OI + very negative funding | Crowded shorts | Short squeeze risk |
| Rising OI + neutral funding + spot strength | Healthier participation | Trend continuation possible |
| Falling OI after a flush | Position reset | Better base for the next move |
How crowding turns into a squeeze
A common setup is BTC chopping sideways while OI keeps climbing and funding stays richly positive. That tells you longs are leaning in, but price is not advancing much. If support breaks, those same longs can become forced sellers and accelerate the move down.
When this signal fails
The biggest mistake is fading crowding too early. In strong trends, elevated funding can stay elevated much longer than traders expect.
Common Mistake: Treating high funding as an automatic short signal. In a strong spot-led trend, stretched funding can persist without an immediate reversal.
Bottom Line: Funding plus OI works best as a warning and timing tool, especially when macro or spot-flow context is also turning against price.
Signal #5: Miner selling and ETF flow pressure
Why structural spot flows matter
This signal belongs in the forced flows bucket. Unlike narrative indicators, miner selling and Bitcoin ETF flows can affect real spot absorption.
If structural demand is rising, BTC can stay resilient. If structural supply rises while demand weakens, price often becomes fragile before the chart makes it obvious.
Miner distribution as supply pressure
Miner selling matters most when:
- Margins are tight
- Post-halving economics reduce profitability
- Miner reserves trend lower over time
One wallet transfer is usually noise. A sustained decline in miner reserves is more meaningful, though on-chain labels are still estimates, not perfect data.
ETF flows as demand shocks
Spot ETF flow data is most useful as a trend, not a single-day headline. A streak of inflows can create a recurring demand floor. A streak of outflows can remove support.
How to think about net pressure
The better question is not, “Were ETF flows negative today?” It is:
- Are ETF inflows slowing?
- Are miner reserves falling?
- Is BTC still absorbing supply?
- Is price holding key levels despite that pressure?
A bearish example would be miner balances trending lower for two weeks while ETF inflows stall. BTC stays range-bound, but once macro sentiment weakens, support gives way because structural demand is no longer offsetting supply.
Bottom Line: Net flow pressure matters more than isolated miner transfers or one day of ETF data.
Comparing the five signals
| Signal | What it measures | Why it may lead price | Best use case | Typical lag window | Main failure mode |
|---|---|---|---|---|---|
| DXY regime change | Dollar strength and macro conditions | Macro repricing can hit crypto with a delay | Macro risk filter | 1–3 days | Crypto-specific demand overwhelms macro |
| US real yields | Tightness of real financial conditions | Rates market often reprices before crypto | Macro conviction filter | 1–5 days | Strong ETF or crypto-native demand offsets pressure |
| Stablecoin net issuance | Fresh crypto-native liquidity | New buying power can arrive before deployment | Breakout confirmation, medium-term liquidity | Several days to 2 weeks | Minting is treasury reshuffling, not new demand |
| Funding + OI | Leverage crowding and squeeze risk | Extreme positioning can trigger forced moves | Timing and risk management | Intraday to 3 days | Trend persists longer than crowding suggests |
| Miner selling + ETF flows | Structural spot supply and demand | Spot absorption changes before price fully adjusts | Range-break and trend durability analysis | Multi-day to multi-week | Flow data is noisy or overshadowed by macro shock |
The LEAD checklist for signal validation
The easiest way to avoid narrative-driven trades is to force every signal through the same framework.
The LEAD framework
| Step | What to ask | Practical use |
|---|---|---|
| L — Locate the driver | Is this about liquidity, leverage, or forced flows? | Identifies the mechanism |
| E — Establish the lag window | Should this matter today, in 3 days, or over 2 weeks? | Prevents premature trades |
| A — Assess regime fit | Is the market in macro tightening, trend continuation, mania, or liquidation stress? | Filters when the signal is valid |
| D — Demand confirmation | Has price, volume, or flow data confirmed the thesis? | Reduces false positives |
Decision Rule: If you cannot clearly explain all four parts, the correlation is probably narrative rather than edge.
L — Locate the driver
Classify the signal first. DXY and real yields are liquidity signals. Funding and open interest are leverage signals. Miner selling and ETF flows are forced-flow signals.
That may sound basic, but it prevents you from mixing very different types of evidence without a clear framework.
E — Establish the lag window
Not every signal works on the same clock:
- Funding and OI can matter within hours
- DXY and real yields often matter over 1 to 5 days
- Stablecoin issuance and miner or ETF pressure often matter over days to weeks
A — Assess regime fit
A signal can be directionally correct and still useless in the wrong regime.
Macro signals tend to work better in tightening or broad risk-off periods. Stablecoin growth matters more in expansionary, crypto-native environments. Funding extremes become more dangerous during choppy or exhausted trends.
D — Demand confirmation
A signal without confirmation is just a hypothesis.
Examples of confirmation include:
- BTC losing or reclaiming a key level
- Spot volume expanding
- ETF flow trends persisting
- OI reacting the way your thesis expects
How to backtest whether a signal actually leads price
A good backtest is event-based, not memory-based.
Step 1: Define the asset, timeframe, and regime
Pick one market and one context.
Example: BTC daily data during macro tightening months only.
Do not mix bull mania, liquidation stress, and quiet chop into one sample.
Step 2: Mark signal events with rules
Turn the idea into something testable.
Examples:
- DXY closes above its 20-day high
- The 10-year real yield rises for two consecutive sessions
- Stablecoin supply increases above a chosen threshold and exchange balances also rise
- Funding exceeds a threshold while OI is in the top decile
- ETF flows turn negative for three consecutive sessions while miner reserves decline
Step 3: Measure forward returns
Check BTC forward returns after each event across multiple windows:
- 1 day
- 3 days
- 5 days
- 10 days
This helps show whether the signal tends to lead immediately or with a delay.
Step 4: Compare results across lag windows
Track:
- Hit rate
- Average return
- Median return
- Maximum adverse excursion
Sometimes a signal is directionally right but noisy on day one and more useful by day three.
Step 5: Log failure conditions
This is often where the real edge appears.
Write down what broke the signal:
- ETF inflows accelerated despite macro headwinds
- BTC had a major idiosyncratic catalyst
- Funding stayed extreme because spot demand was leading
- Stablecoin minting was just chain migration
Common Mistake: Changing thresholds after seeing results. That is how data-mining creates false confidence.
Bottom Line: Backtest events, not stories. The goal is to find repeatable conditions, not to prove a narrative you already prefer.
Common mistakes
Treating every macro move as actionable
Not every DXY bounce or yield uptick matters. The broader regime determines whether macro is the main driver.
Ignoring crypto-native flows
A macro-bearish setup can fail if stablecoin liquidity is expanding and ETF demand remains strong.
Using one signal without confirmation
No single metric is enough. A stretched funding setup without price confirmation is just a warning. Rising real yields without weakening BTC structure may not be tradable.
Forgetting that relationships change across regimes
The same indicator can mean different things in different conditions. High funding may be bearish in a tired market and neutral in a strong spot-led trend.
Bottom Line: The biggest mistake is not being wrong about a signal. It is being too confident in a signal outside the regime where it works.
Trade setup confirmation checklist
Before acting on any correlation, require multiple forms of evidence.
Implementation checklist
- At least one macro or flow driver is clearly identified
- At least one positioning signal supports the setup
- The expected lag window is defined
- The current market regime fits the signal
- BTC price structure confirms the thesis through level, trend, or volume
- A failure point is defined before entry
Decision Rule: No trade should rely on one correlation alone.
Example of a stronger bearish setup
A higher-conviction bearish read might look like this:
- DXY breaks above a recent range
- 10-year real yields continue rising
- Funding is strongly positive and OI is elevated
- ETF inflows slow or turn negative
- BTC loses a key support level on rising sell volume
That aligns macro tightening, crowded longs, weaker structural demand, and price confirmation.
Example of a stronger bullish setup
A higher-conviction bullish read might look like this:
- Stablecoin net issuance expands over several sessions
- ETF inflows remain healthy
- OI has flushed and funding has reset to negative or neutral
- BTC reclaims resistance with strong spot-led volume
That aligns fresh liquidity, structural demand, cleaner positioning, and confirmed price strength.
Bottom line: use correlations as context, not prophecy
The most useful market correlations do not predict price in any magical way. They help you spot pressure building before price alone makes it obvious.
DXY and real yields tell you whether macro liquidity is tightening. Stablecoin issuance tells you whether crypto-native buying power may be growing. Funding and OI show whether leverage can amplify the next move. Miner selling and ETF flows show whether spot demand is absorbing structural supply.
What matters is the process.
What to monitor each week
A practical weekly watchlist:
- DXY trend changes, not just the level
- 10-year US real yield trend on FRED
- Net USDT and USDC supply changes
- Exchange-linked stablecoin balances
- Funding and aggregated OI extremes
- Multi-day ETF flow trends
- Sustained miner reserve changes
How to turn this into a repeatable process
Use the LEAD checklist every time:
- Locate the driver
- Establish the lag window
- Assess regime fit
- Demand confirmation
If you do that consistently, these signals become more than market trivia. They become a practical way to filter noise, improve trade selection, and avoid relying on one indicator in isolation.
FAQ
What makes a market correlation useful for trading?
A useful correlation does more than move alongside price. It needs a plausible mechanism, a repeatable lead-lag window, and evidence that it works in a specific regime. If it only explains price after the fact, it may be informative but not tradable.
Why does the BTC-DXY relationship work sometimes and fail at other times?
It tends to strengthen during macro risk-off periods, Fed repricing cycles, and times when Bitcoin trades like a liquidity-sensitive risk asset. It often weakens during crypto-specific demand surges, such as strong ETF inflows or other idiosyncratic catalysts.
Why are real yields more important than nominal Treasury yields?
Real yields better reflect actual financial conditions because they adjust for inflation expectations. Rising real yields increase the opportunity cost of holding non-yielding assets like Bitcoin and often pressure growth-sensitive assets more directly than nominal yields.
Can stablecoin issuance lead crypto price moves?
Yes, stablecoin net issuance can lead price when it reflects genuinely new deployable capital entering the ecosystem. The signal is stronger when supply growth aligns with exchange-linked inflows and improving spot structure, and weaker when issuance is mostly reshuffling or chain migration.
How should traders use funding rate and open interest together?
They work best as a positioning and squeeze-risk signal. High OI with very positive funding can warn of crowded longs and long-squeeze risk, while high OI with very negative funding can point to crowded shorts and short-squeeze potential.
Are Bitcoin ETF flows a leading indicator or just a sentiment gauge?
They can be leading when they show persistent demand or withdrawal pressure over several sessions. One day of inflows or outflows is usually less useful than a trend, especially when combined with miner selling, macro conditions, or price structure.
What is the LEAD checklist?
LEAD stands for Locate the driver, Establish the lag window, Assess regime fit, and Demand confirmation. It is a simple framework for deciding whether a correlation is actionable or just a narrative.
How do you backtest whether a signal really leads BTC price?
Use event-based testing. Define a clear signal rule, mark each event, measure forward BTC returns across multiple windows such as 1, 3, 5, and 10 days, then log hit rate, average return, and failure conditions by regime.
What is the biggest mistake traders make with correlations?
The biggest mistake is relying on one signal in isolation. Correlations are most useful when combined across macro, derivatives, and spot-flow context, then confirmed by actual price behavior rather than assumed to predict the next move on their own.